FAQs
• What is the Soybean Multi-Omic Atlas Database?
The Soybean Multi-Omic Atlas is a comprehensive, spatially resolved, multi-omic single-cell atlas for Glycine max (soybean). It provides integrated datasets on chromatin accessibility and gene expression across multiple tissues and cell types within soybean
• What types of data are available on the Soybean Multi-Omic Atlas Database?
The database offers a variety of omics data from different tissues, including:
-
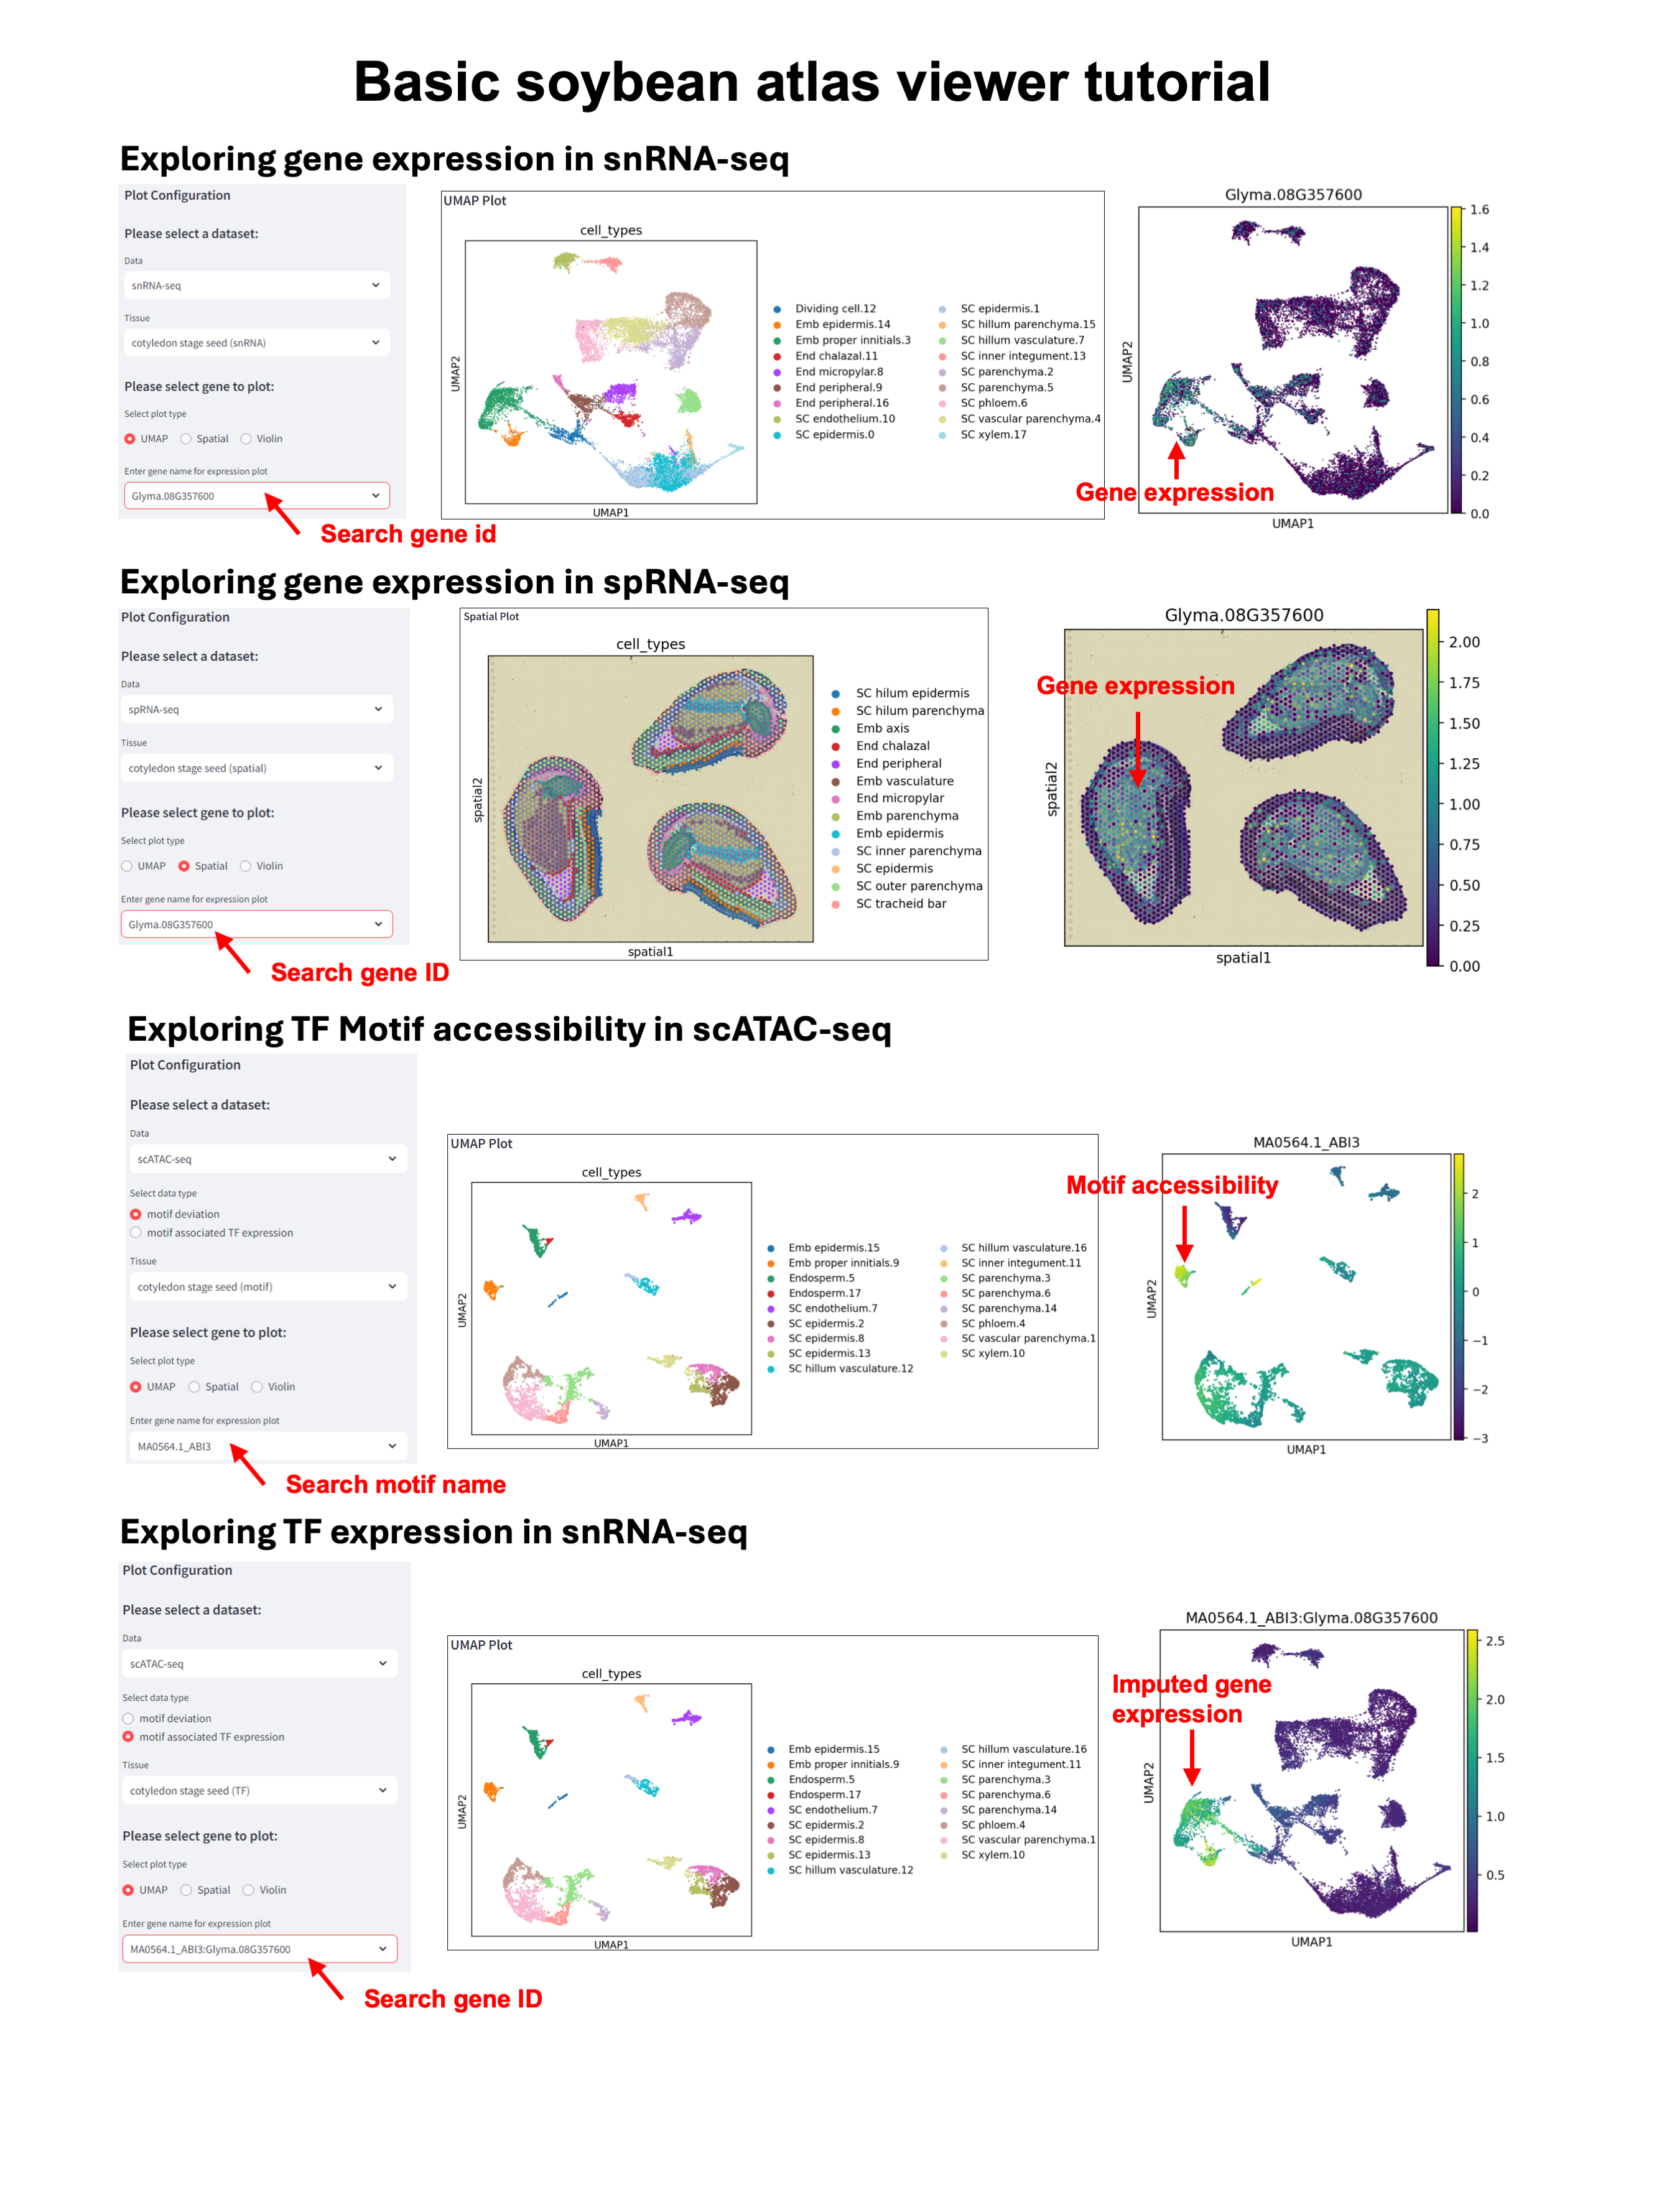
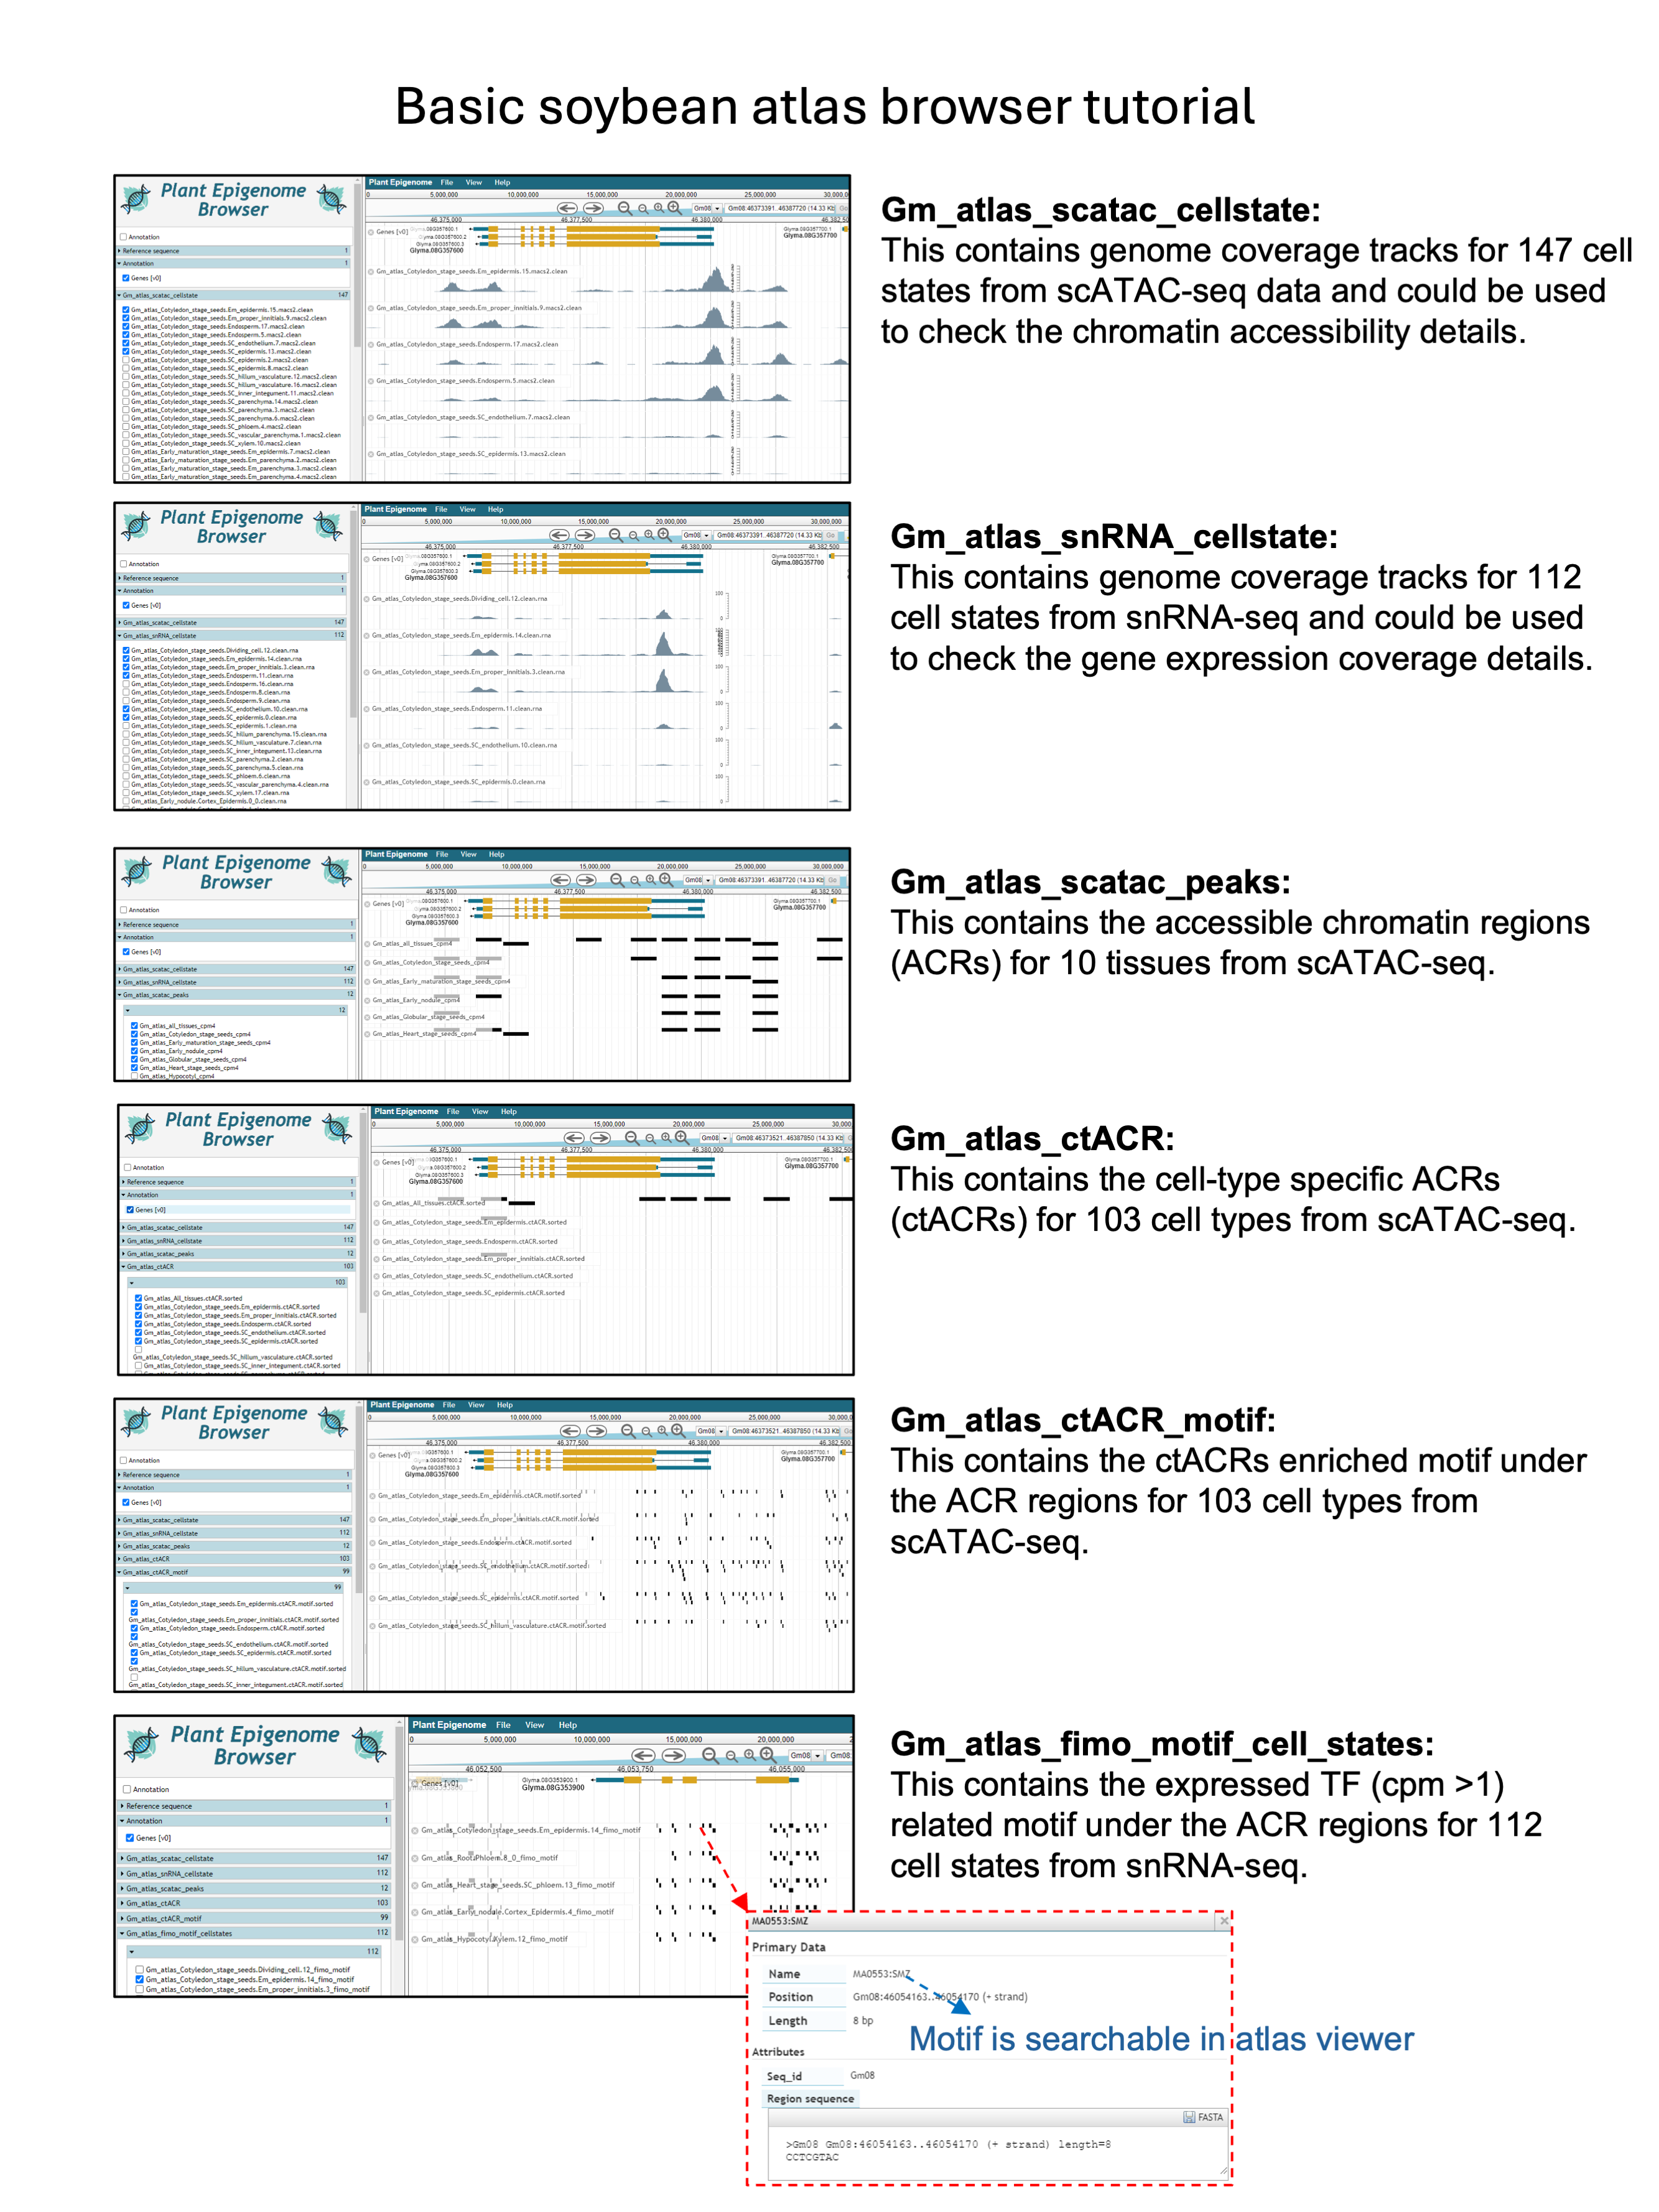
snRNA-seq data: This data provides single-cell resolution gene expression profiles from different tissues and developmental stages. In Atlas Viewer, select the ‘snRNA-seq’ data type to explore the expression of all genes in single cells, or select the ‘scATAC-seq’ data type and ‘motif associated TF expression’ to explore the expression of motif associated TFs; In Atlas Browser, select the tracks in the ‘Gm_atlas_snRNA_cellstate’ group to view the RNA peaks in different cell types.
-
scATAC-seq data: This data provides information about chromatin accessibility and enriched TF binding motifs at single-cell resolution. In Atlas Viewer, select the ‘scATAC-seq’ data type and ‘motif deviation’ to explore enriched binding motif in single cells. In Atlas Browser, select the tracks in the ‘Gm_atlas_scatac_cellstate’ group to view the chromatin accessibility peaks in different cell types; select the tracks in ‘Gm_atlas_ctACR_motif’ to view the location of enriched TF binding motifs in different cell types.
-
spRNA-seq data: This data provides the spatial gene expression on different soybean tissue sections. In Atlas Viewer, select the ‘spRNA-seq’ data type to explore the spatial expression of all genes.
• What can I do with the Viewer and Browser? what’s the difference?
-
The Atlas Viewer: The Viewer is a Streamlit-based application designed to visually explore gene expression (snRNA-seq) and chromatin accessibility (scATAC-seq) data at single-cell resolution. It uses a UMAP (Uniform Manifold Approximation and Projection) to display single cells and their gene expression profiles, allowing you to view chromatin accessibility and TF motif data as well. Additionally, the Viewer includes spatial transcriptomics data, letting you plot gene expression on both UMAP and spatial dimensional plots, providing insights into spatial gene expression patterns.
-
The Atlas Browser: The Browser is a JBrowse instance that allows you to explore tracks derived from snRNA-seq and scATAC-seq data in a more traditional genome browser format. It includes cell-type-specific gene expression and chromatin accessibility tracks, along with motif location tracks, enabling detailed investigation of regulatory elements and gene expression patterns within specific regions of the genome.
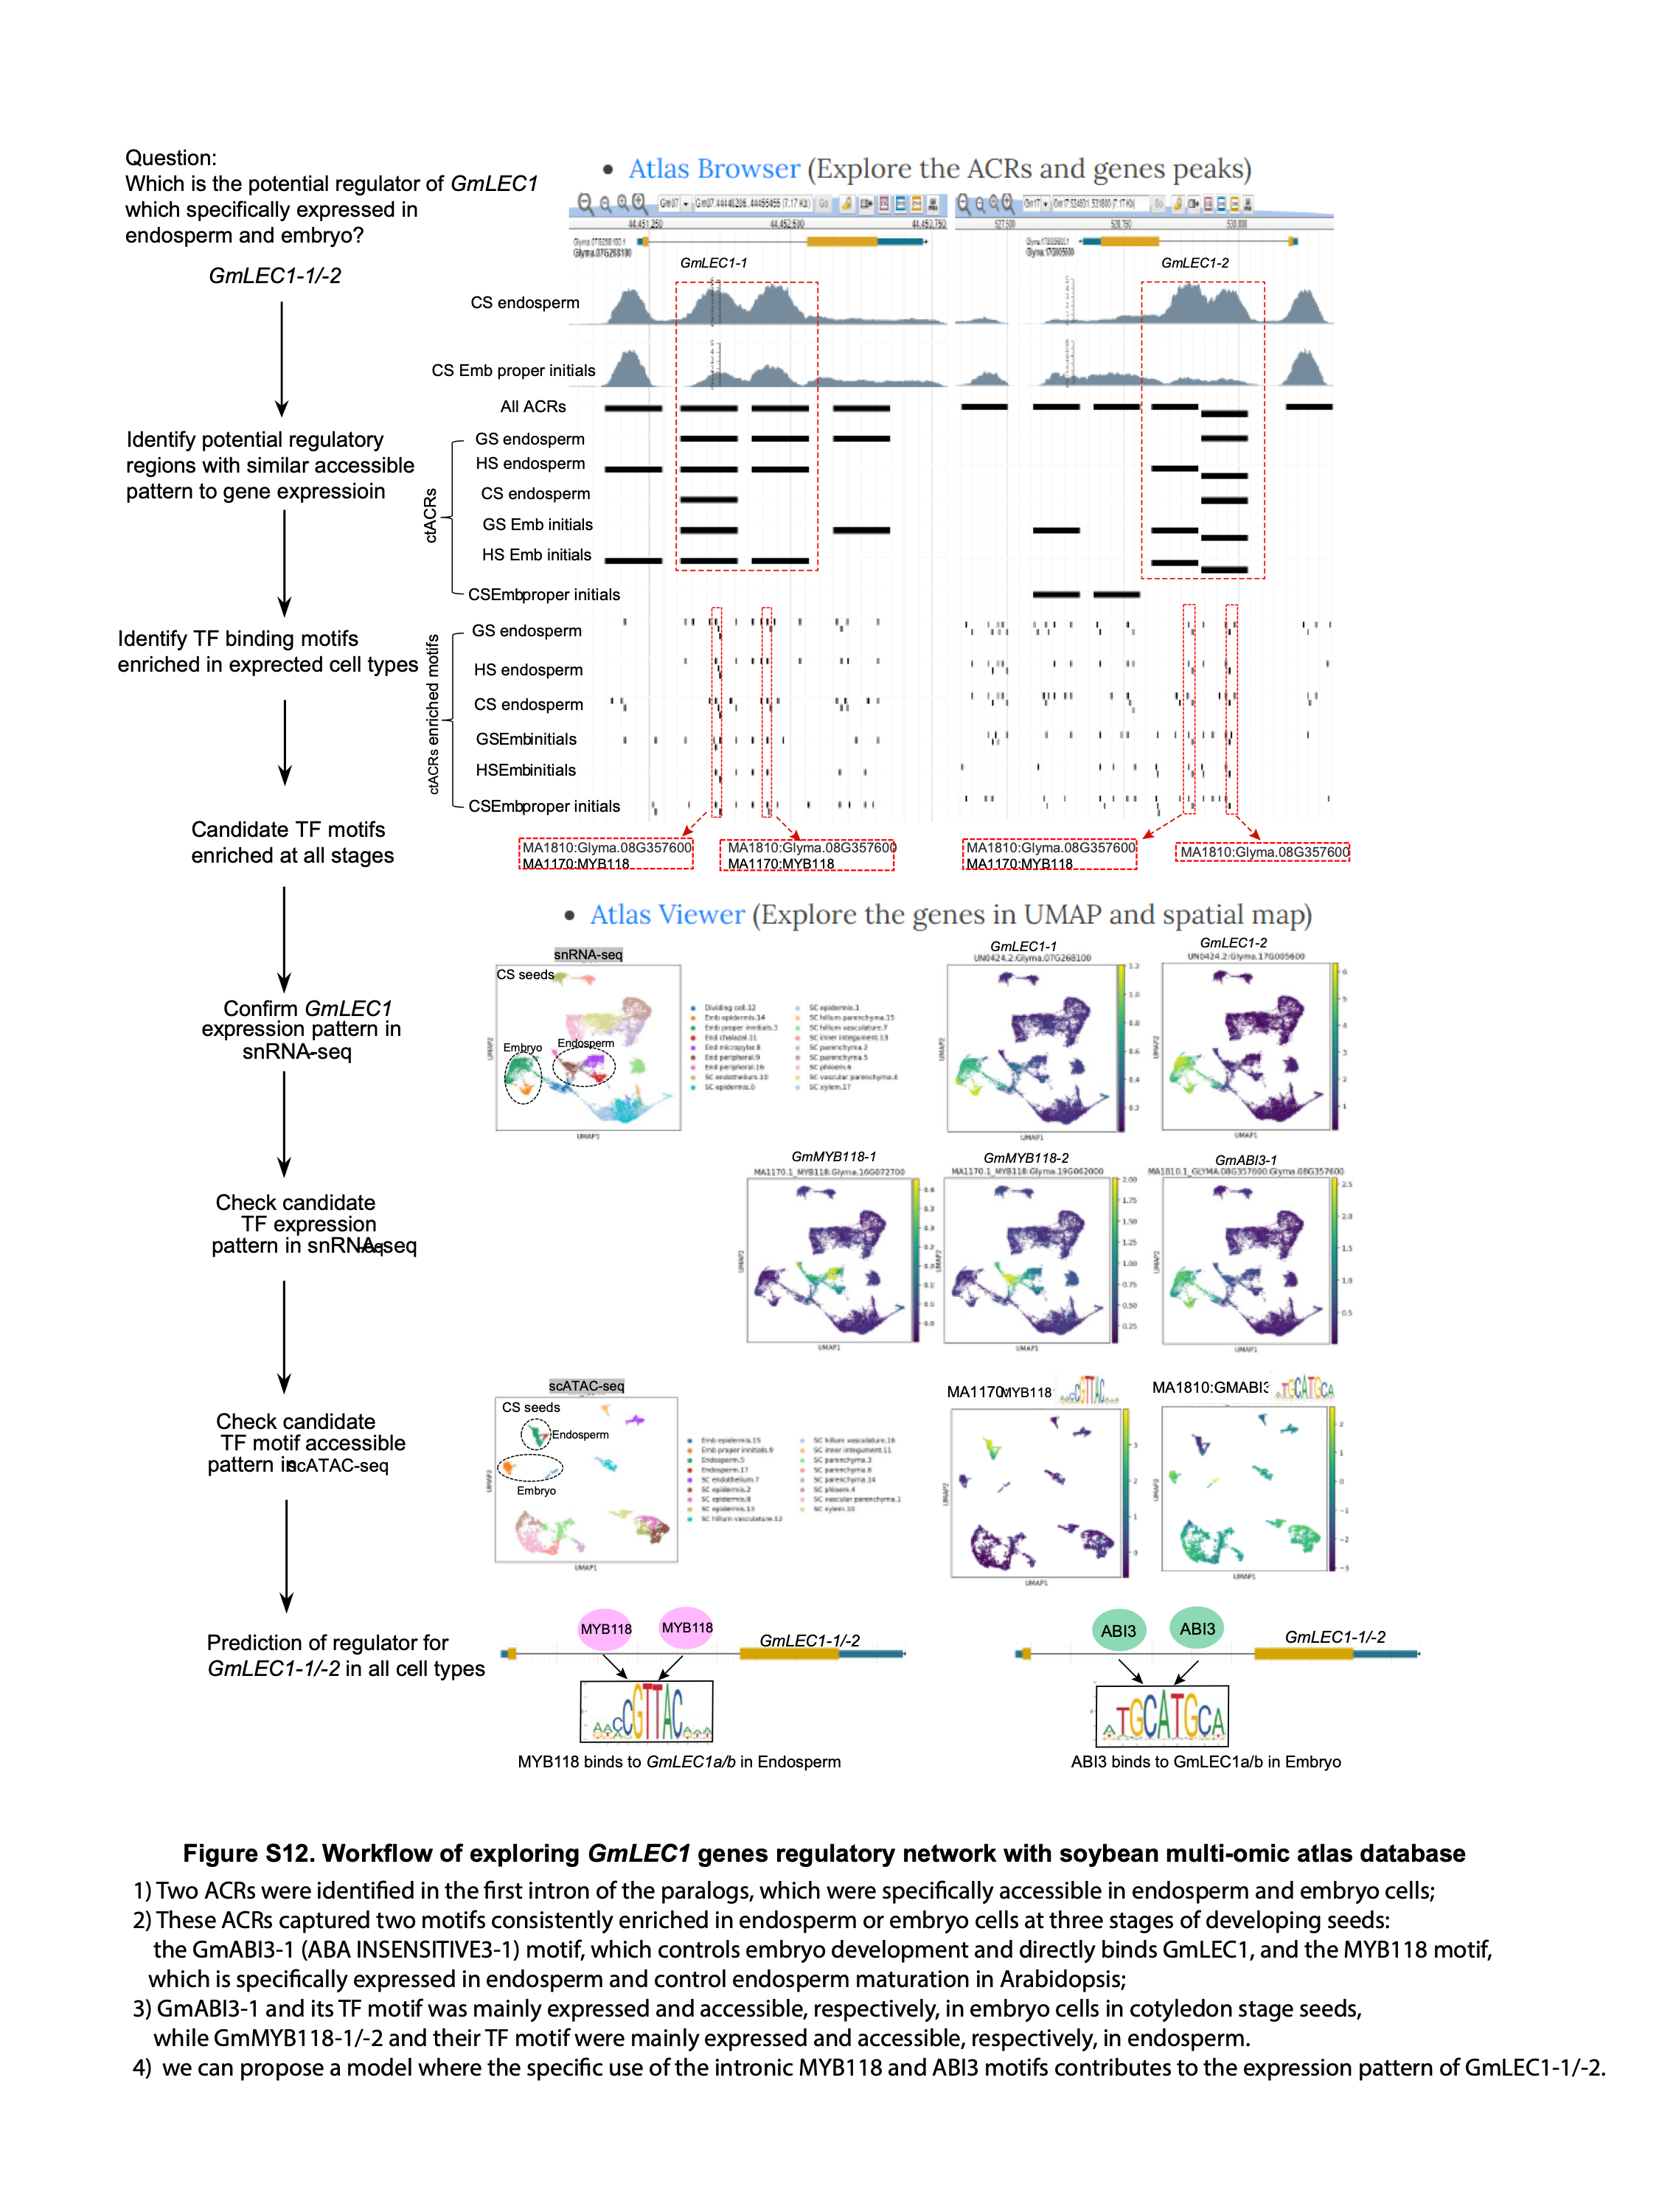
• How do I explore the gene regulatory network of my favorite genes in the database?
With the Atlas Browser, you can find your genes by entering the gene ID in the location and search box. Identify the potential regulatory regions (e.g. ACRs in the promoters or introns) associated with your target gene. Under the potential regulatory regions, identify the TF binding motifs enriched in expected cell types (tracks). With the Atlas Viewer, you are able to visualize the gene expression (in snRNA-seq data) and binding motif accessibility (in scATAC-seq data) of candidate TFs in the single-cell data.
A specific example of GmLEC1-1/-2 regulation network can be demonstrated using our database (Figure S12): 1) Two ACRs were identified in the first intron of the paralogs, which were specifically accessible in endosperm and embryo cells; 2) These ACRs captured two motifs consistently enriched in endosperm or embryo cells at three stages of developing seeds: the GmABI3A (ABA INSENSITIVE3a) motif, which controls embryo development and directly binds GmLEC1, and the MYB118 motif, which is specifically expressed in endosperm and control endosperm maturation in Arabidopsis; 3) GmABI3a and its TF motif was mainly expressed and accessible in embryo cells in cotyledon stage seeds, while GmMYB118a/b and their TF motif were mainly expressed and accessible in endosperm. Thus, we can propose a model where the specific use of the intronic MYB118 and ABI3 motifs contributes to the expression pattern of GmLEC1-1/-2