Open research resource

Explore soybean biology,
cell by cell.

A spatially resolved multi-omic atlas connecting gene expression, chromatin accessibility, regulatory motifs, and tissue context across Glycine max development.

Developmental atlas GLYCINE MAX
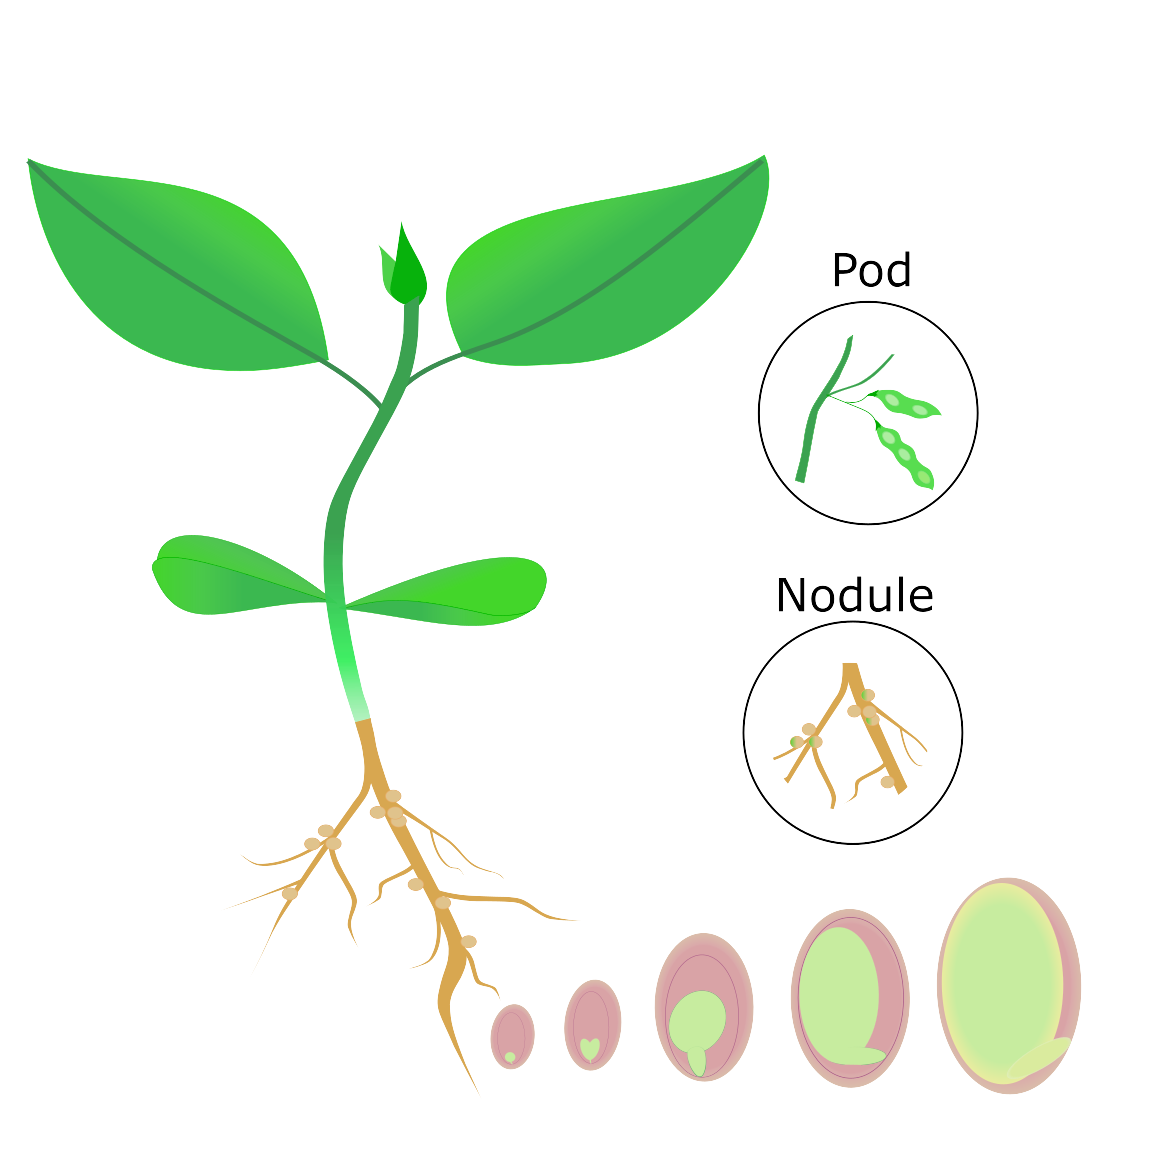
Soybean plant, pod, nodule, and seed development illustration
snRNA-seq: Gene expression
scATAC-seq: Chromatin access
spRNA-seq: Spatial context
Explore the database

Choose the view that fits your question

Move from cell-level patterns to genomic regions without losing biological context.

01
Cell & spatial view

Atlas Viewer

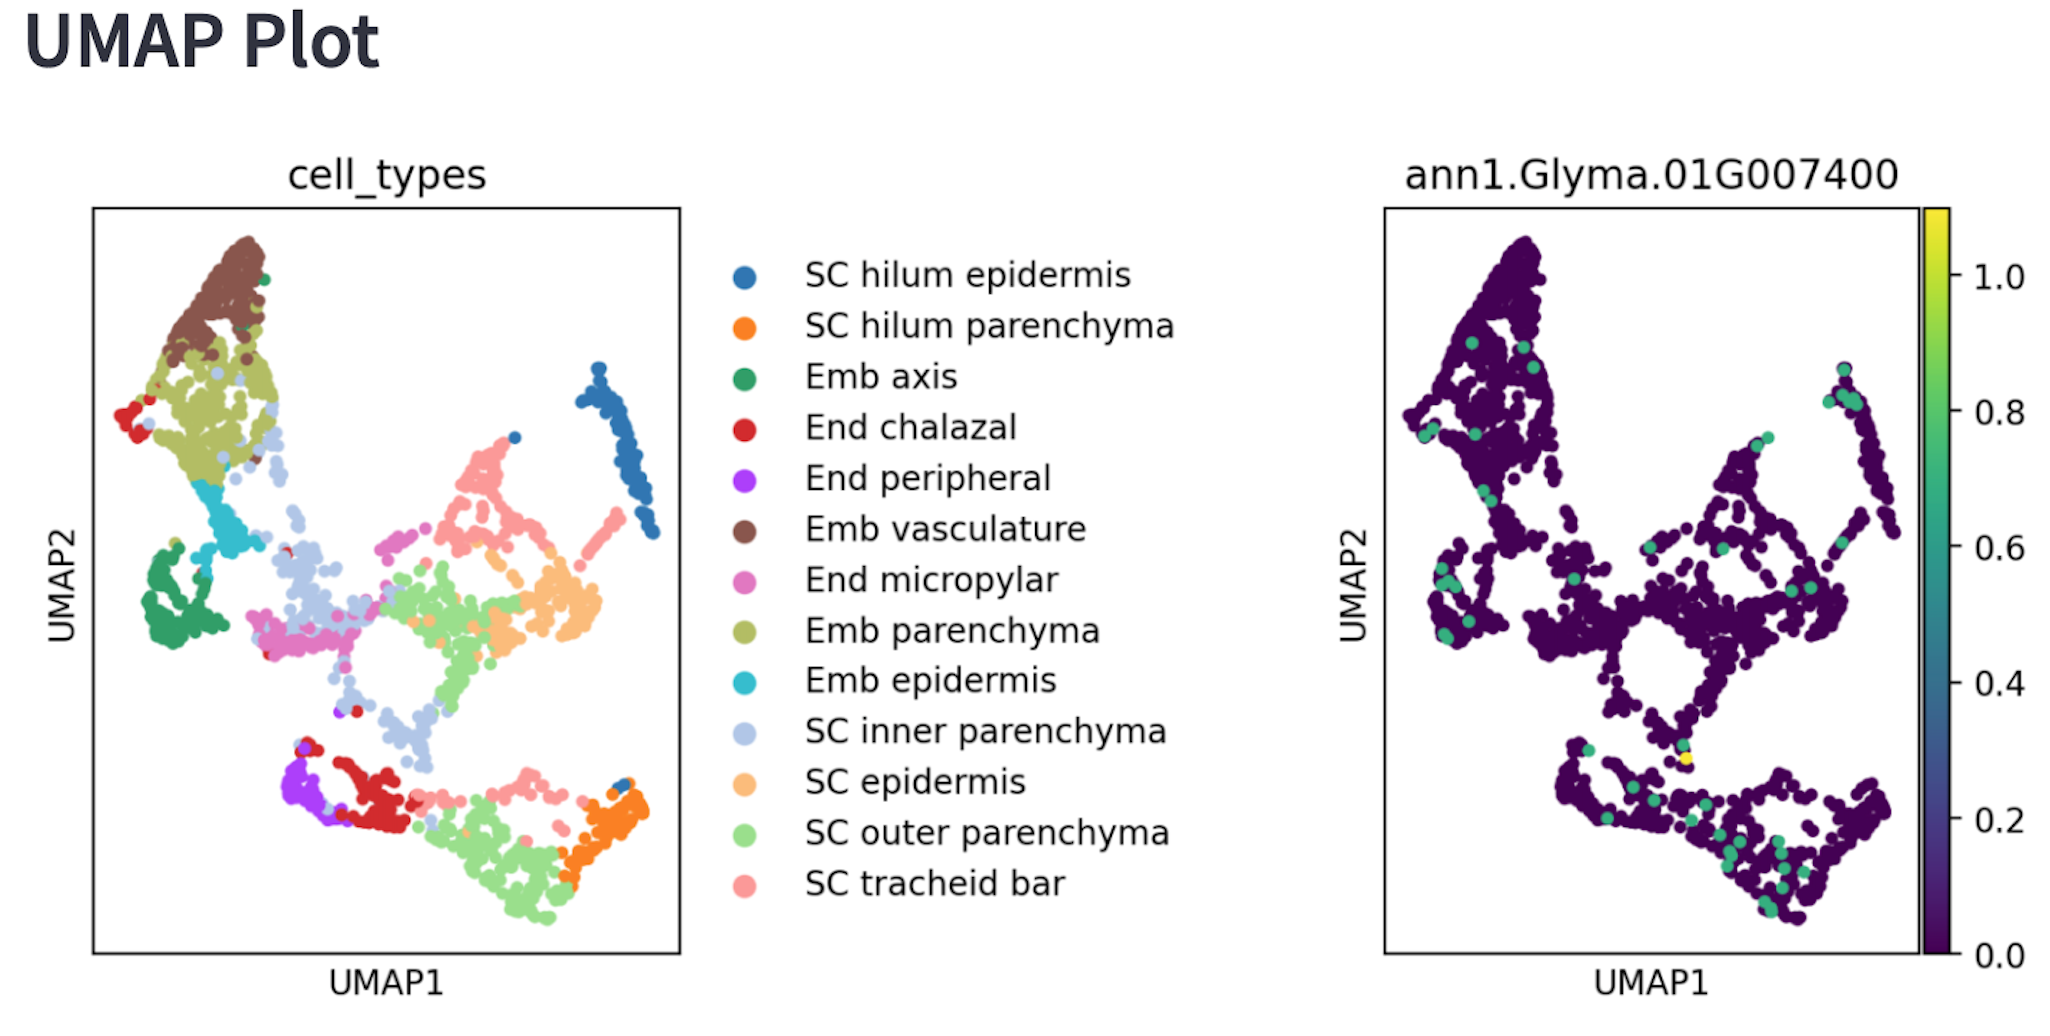
Search a gene or motif, compare cell types, and visualize expression or accessibility in UMAP and spatial coordinates.

  • Gene expression by cell type
  • TF motif activity and expression
  • Spatial tissue maps
Launch Atlas Viewer
Atlas Viewer interface preview
02
Genome-scale view

Genome Browser

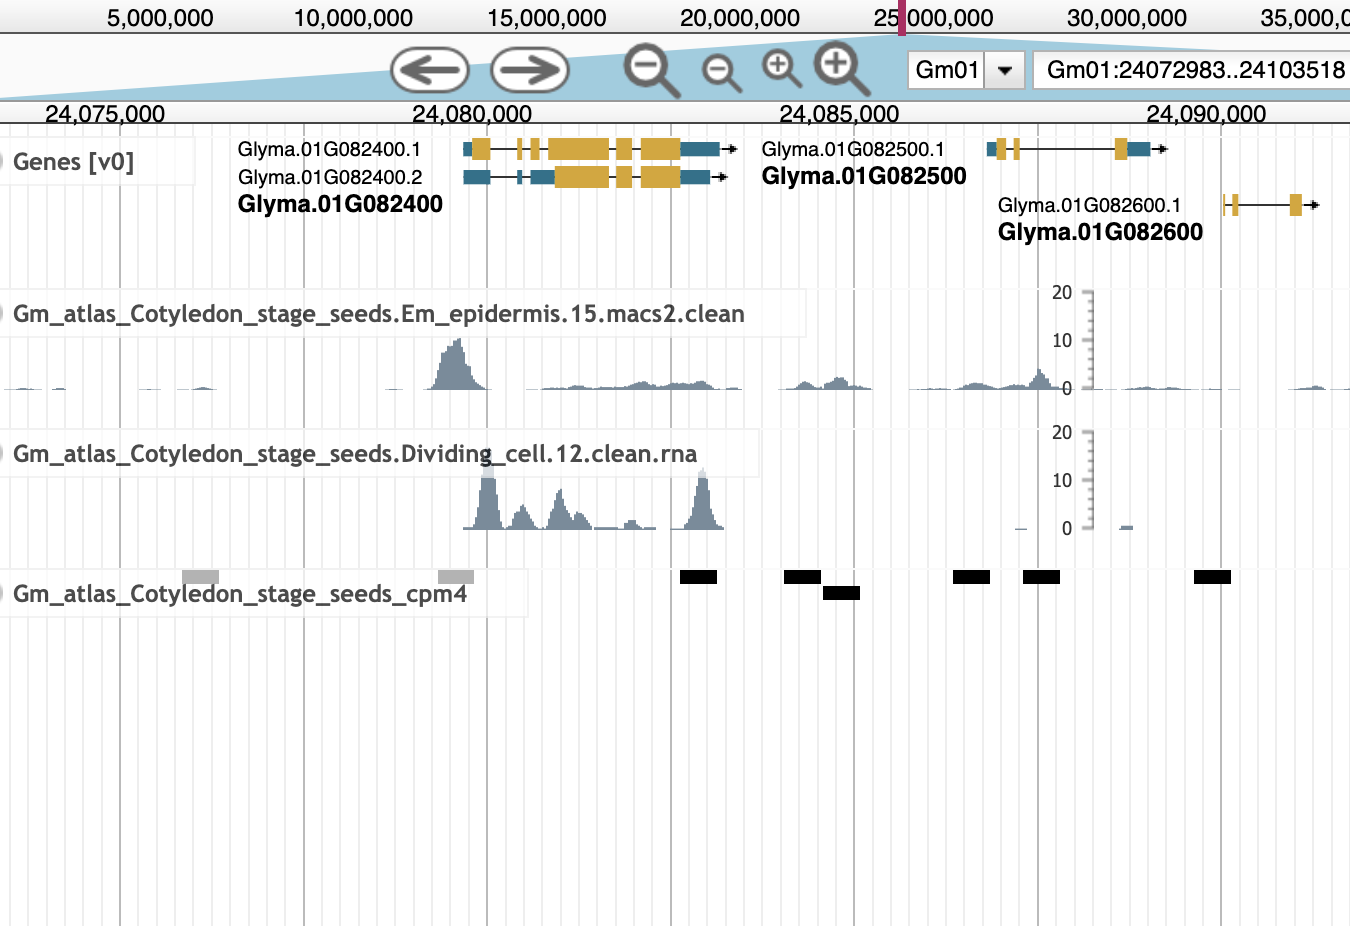
Inspect genes, accessible chromatin regions, expression tracks, and enriched motifs at exact genomic locations.

  • Cell-state RNA and ATAC tracks
  • Cell-type-specific ACRs
  • Regulatory motif locations
Launch Genome Browser
Soybean Genome Browser interface preview
Data modalities

Multiple layers, one atlas

Integrated assays reveal how cell identity, regulation, and tissue position work together.

RNA

Single-nucleus RNA-seq

Explore cell-resolved gene expression across soybean tissues and developmental stages.

How to explore
ATAC

Single-cell ATAC-seq

Discover accessible chromatin and enriched transcription factor binding motifs.

How to explore
SP

Spatial RNA-seq

Place gene expression back into its native tissue and developmental context.

How to explore
A practical workflow

From a favorite gene to a regulatory hypothesis

Start broad in the cell atlas, focus on candidate regulatory regions, then connect motif accessibility with transcription factor expression.

View the step-by-step example
  1. 1
    Find the signal

    Search your gene and identify the cells or tissue regions where it is active.

  2. 2
    Inspect the locus

    Use the Genome Browser to locate nearby accessible chromatin regions.

  3. 3
    Connect regulators

    Compare enriched motifs with transcription factor expression and accessibility.

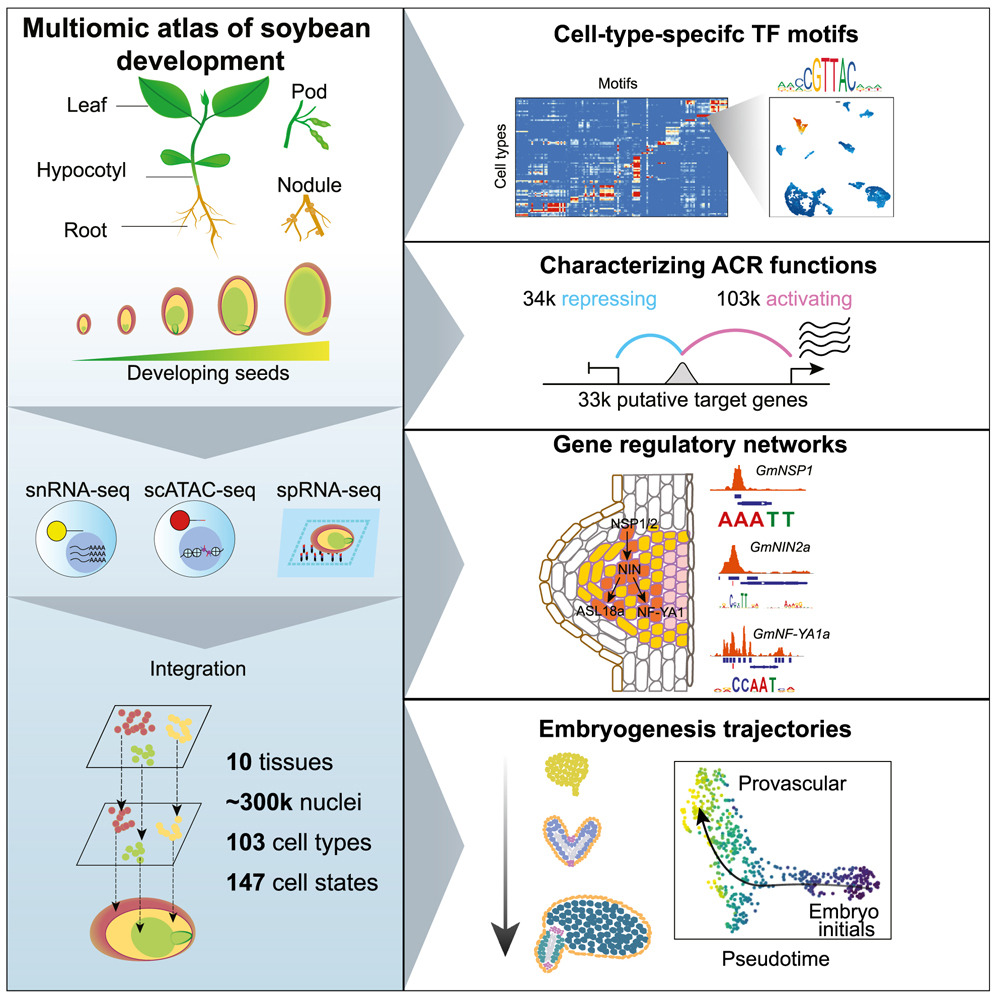
Graphical abstract of the soybean multi-omic atlas study
The research

A spatially resolved multiomic single-cell atlas of soybean development

Zhang, Luo, Marand et al. · Cell · 2024

Read the publication